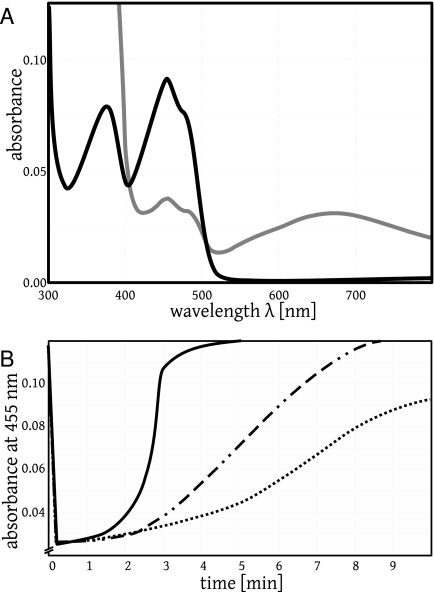
FIG. 2.
Reduction of a flavoprotein (human GR mutant A58/A63) with NADPH and reoxidation by O2 or by MB in assay buffer at pH 6.9. (A) The black curve shows the original spectrum of the oxidized flavoprotein (8.2 μM) with an absorption maximum at 455 nm. The protein-bound FAD was then reduced with 200 μM NADPH under aerobic conditions to give FADH−. This resulted in a decrease in the absorption at 455 nm by 78% (not shown). Subsequent auto-oxidation led to partially reoxidized protein-bound flavin and indirectly to the production of NADP+ (gray curve). Here, the characteristic broad peak at around 680 nm represents the complex between protein-bound FADH− and NADP+ (33). The original spectrum of oxidized protein-bound flavin (black curve) was recovered after 20 min by auto-oxidation and was 10 times faster by oxidation with 3 μM MB (Fig. 2B). (B). Traces representing the kinetics of FADH− reoxidation by MB. Mutant flavoprotein (9.2 μM) had been incubated under aerobic conditions in GR assay buffer containing 0 to 3 μM MB and monitored at 455 nm in a total volume of 700 μl. The addition of NADPH at 100 μM led to a decrease in the absorption at 455 nm. Reoxidation took place according to the equation protein-bound FADH− + MB+→protein-bound FAD + leucoMB, with leucoMB being auto-oxidized instantaneously. The highest rate of absorbance increase was 0.120 min−1. Using a Δɛ of 9.0 mM−1 cm−1 for the difference between reduced flavin and oxidized flavin and correcting for the auto-oxidation of reduced flavin, the second-order rate constant for the reaction of equation 9 was estimated to be 7,500 ± 1,200 M−1 s−1 (15, 33). Solid curve, 3 μM MB; dashed-dotted curve, 0.6 μM MB; dotted curve, 0 μM MB.

