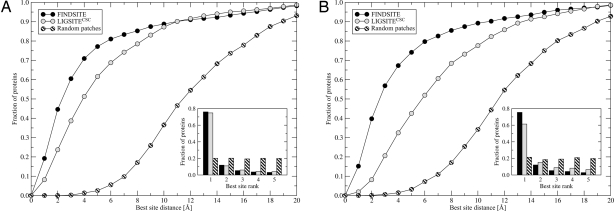
Fig. 2.
Performance of FINDSITE and LIGSITECSC compared with randomly selected patches on a target protein surface using target crystal structures (A) and TASSER models (B). The results are presented as the cumulative fraction of proteins with a distance between the center of mass of a ligand in the native complex and the center of the best of top five predicted binding sites, less than or equal to the distance displayed on the x axis and the rank of the best pocket selected from the top five predictions (Inset).

