Fig. 2.
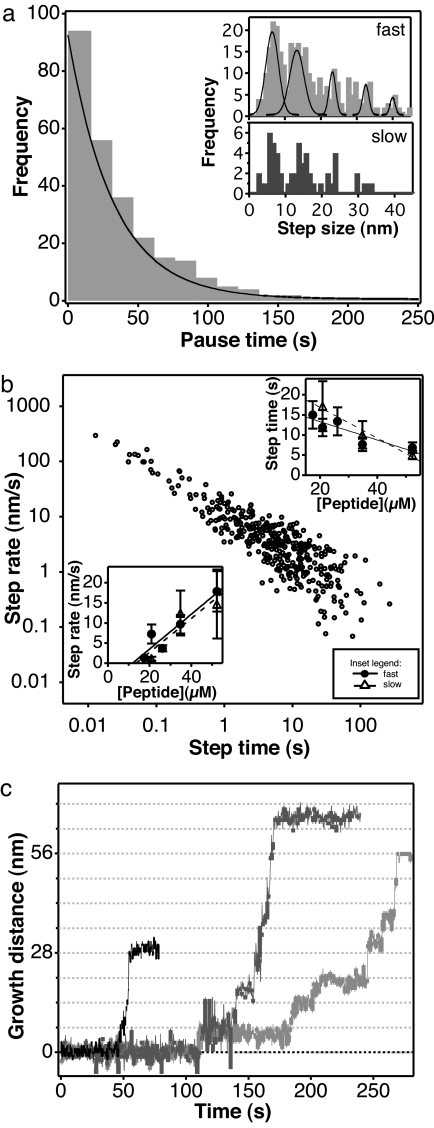
Quantitative analysis of discontinuous amyloid fibril growth. (a) Distribution of pause time measured on the fast-growing end. Pauses are considered if they last for at least three consecutive line scans (≈1 s). The continuous line is the exponential fit. (Inset) Distribution of step size for the fast- and slow-growing fibril ends. Gaussian fits to the peaks in the fast-growing-end histogram are at 6.5 ± 0.2 nm, 13.3 ± 0.3 nm, 23.2 ± 0.3 nm, 32.5 ± 0.4 nm, and 40 ± 0.6 nm, respectively. (b) Step rate versus step time for the total number of observations (including fast and slow ends, n = 372). (Upper Inset) Step time versus total peptide concentration. (Lower Inset) Step rate versus total peptide concentration. (c) Kymograms displaying cooperative run-on events by the coalescence of ≈7-nm steps.

