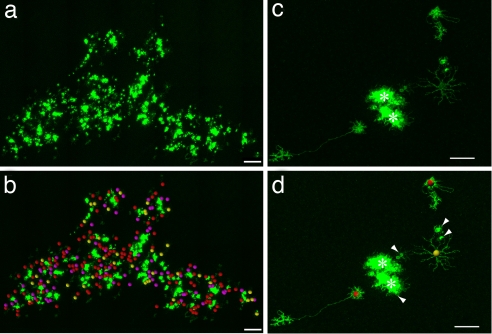
Fig. 3.
Clones with multiple HC subtypes. (a and b) A large clone containing 137 H1, 39 H2, and 72 H3 cells. (Scale bar, 300 μm.) (a) Before quantification. (b) After quantification (c and d) A small clone with three HCs, two H1, and one H2. (c) Before quantification. (d) After quantification. (Scale bar, 40 μm.) Red spheres, H1; yellow spheres, H2; purple spheres, H3; white arrowheads, photoreceptors; asterisks, clonally related columns.

