Fig. 4.
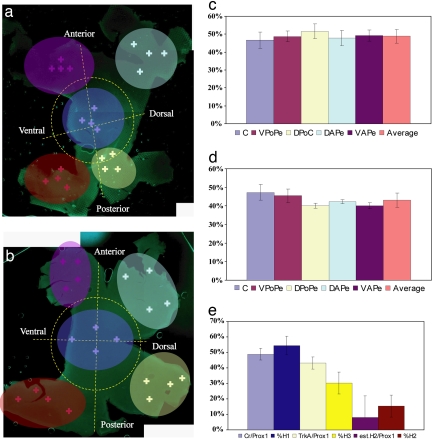
Subtype composition of wild-type retina and E1.5 clones. (a) E18 retinas immunostained for Calretinin as well as Prox1, colored crosses indicate the shaded regions where stained cells were scored. (b) Retina stained for TrkA as well as Prox1. (c) The average percentage of Prox1+ cells that stained for Calretinin, as well as the local averages over the different quadrants marked in a. (d) The average percentage of Prox1+ cells that stained for TrkA, as well as the local averages over the different quadrants marked in b. (e) The percentage of HCs that were H1, H2, and H3 cells found in E1.5 clones (dark blue, brown, and yellow, respectively) and the percentage of Calretinin+/Prox1+ and TrkA+/Prox1+ HCs (light blue and light yellow, respectively). H2 cells (purple) are estimated by subtracting the average of TrkA and Cr HCs. Abbreviations (c and d) are as in Table 1.

