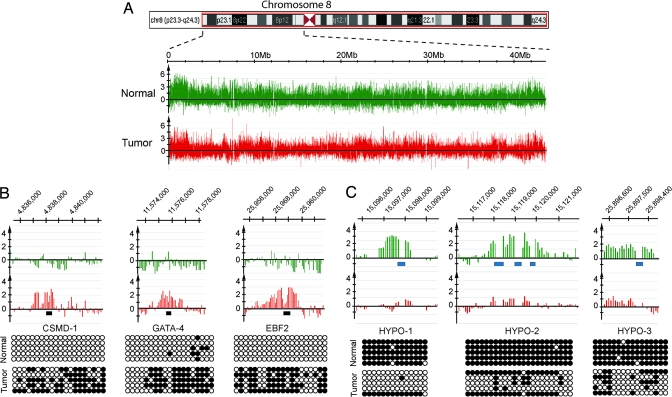
Fig. 2.
DNA methylation patterns along the short arm of chromosome 8. (A) Schematic display of a chromosome 8 region and the methylation signals (MIRA-enriched DNA versus input DNA) in normal lung tissue and a matching stage I SCC tumor (tumor 2). (B) Examples of hypermethylated CpG islands. The methylation array profiles are shown on the top, and the confirmation of tumor-associated methylation by bisulfite sequencing is shown near the bottom. Open circles, unmethylated CpG sites; closed circles, methylated CpG sites. The black bars indicate the regions analyzed by bisulfite sequencing. (C) Examples of hypomethylated SINE sequences in lung tumors. The array signals are shown on the top. Blue bars denote the location of SINE elements. Confirmation of the SINE methylation status by bisulfite sequencing is shown at the bottom.

