
Fig. 6.
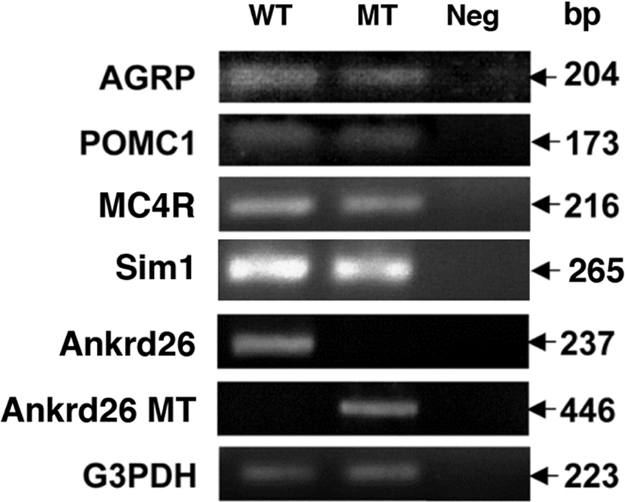
RT-PCR analysis of RNA from hypothalamus of Ankrd26 MT and control mouse brain. Expression levels of AGRP, POMC1, Sim1, MC4R, Ankrd26 and Ankrd26 MT transcripts were measured by RT-PCR using specific primers designed for each gene as described in Materials and Methods. For the analysis of the MT Ankrd26 transcript, the forward primer was within the exon 24 of the Ankrd26 gene, and the reverse primer was within the Geo region of the gene trap vector (http://baygenomics.ucsf.edu). Numbers at the right represent the expected size of the amplified product for each gene. G3PDH was used as an internal control for the experiment.