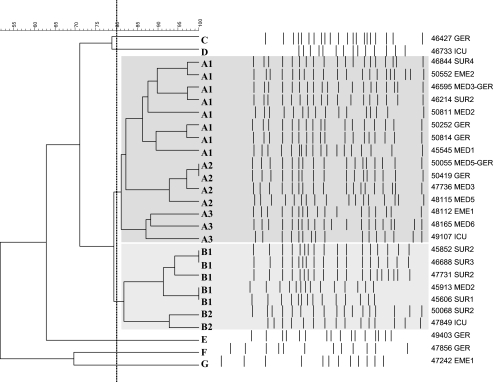
FIG. 1.
Dendrogram (unweighted-pair group method using average linkages and Dice coefficient) showing the relatedness of PFGE patterns for the 28 E. coli ESBL producers. The dotted line indicates 80% similarity. Related A and B clusters showing >80% similarity are shaded dark gray and light gray, respectively. The isolate numbers and the wards where the patients recovered are indicated and refer to Table 1.

