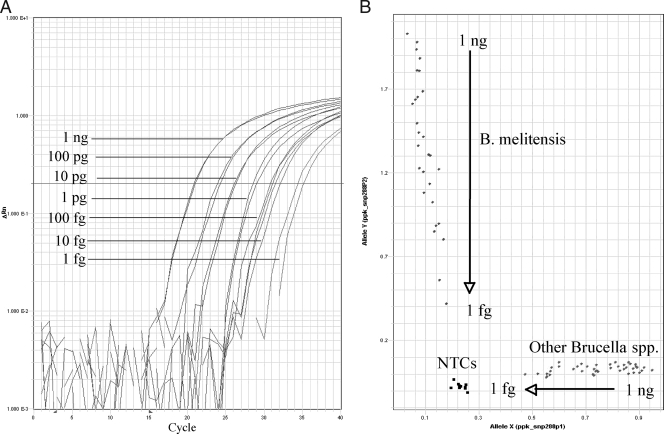
FIG. 1.
Real-time PCR and allelic discrimination plots from TaqMan MGB assays for an SNP defining Brucella melitensis. Ten samples (4 B. melitensis and 6 other Brucella species samples) were run at concentrations decreasing from 1 ng/μl to 1 fg/μl. (A) Amplification curves for B. melitensis samples run in duplicate. (B) Allelic discrimination plots for all samples. Samples at the top left are B. melitensis and at the bottom right are other Brucella spp., and at the bottom left, squares near the plot origin are no-template controls (NTCs; n = 8). Numbers on the axes represent degrees of differentiation of points and are based on the threshold values of the reactions.

