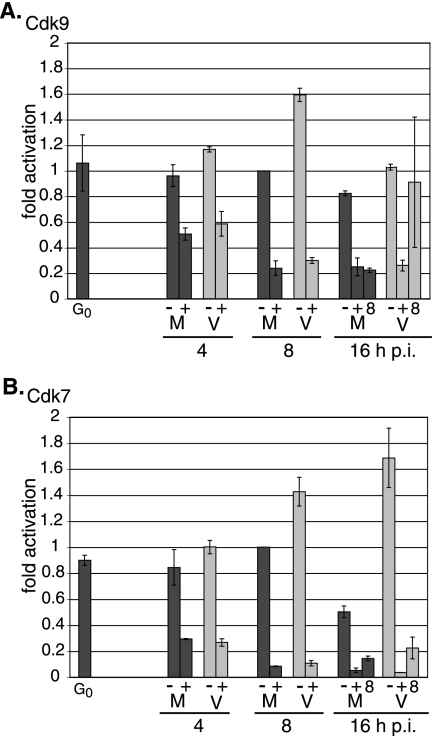
FIG. 7.
Effect of roscovitine on cdk9 and cdk7 RNA levels. G0-synchronized cells were released into G1 and infected with HCMV Towne at an MOI of 5 or with mock supernatant. Cells were treated with 16 μM roscovitine or DMSO at the time of infection or at 8 h p.i. and were harvested at 4, 8, and 16 h p.i. Total RNA was isolated and analyzed by quantitative real-time RT-PCR using primers and probes listed in Table 1 for cdk9 (A) and cdk7 (B) RNAs. The values for cdk9 and cdk7 were normalized to that of G6PD RNA for each sample. For each time point, two separate experiments were performed and duplicate reactions were analyzed. A standard curve for each gene was used to calculate the relative amount of specific RNA present in a sample, which was then converted to fold activation relative to DMSO-treated, mock-infected 8 h p.i. samples. The graphs shows the averages from the two experiments, and the range bars indicate the highest and lowest values. G0, cells released from G0; M, mock treated; V, HCMV infected; −, DMSO treated; +, roscovitine treated at the time of infection; 8, roscovitine treated at 8 h p.i.

