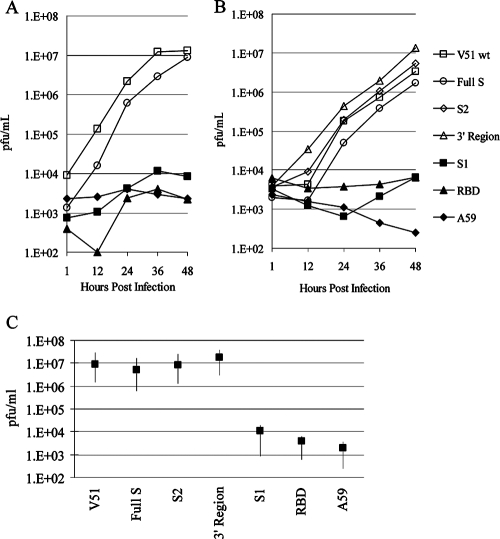
FIG. 2.
Mapping of host range determinants on human HepG2 cells. Monolayers of HepG2 cells were infected at an MOI of 5, and virus titers at indicated time points were determined via plaque assay with murine DBT cells. (A and B) Representative growth curves reported as PFU per milliliter. Data points are identified by the key provided on the far right. (C) Average titers of recombinants across multiple growth curves. The black squares indicate the average titers, while the arms signify the maximum and minimum titers recorded per recombinant across a minimum of four growth curves.

