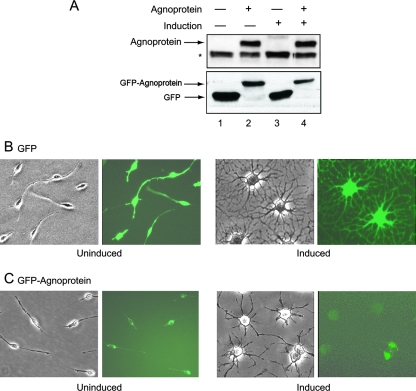
FIG. 1.
Expression of agnoprotein in CG-4 cells. (A) (Top) Immunoblot analysis demonstrating the presence of GFP-agnoprotein in uninduced and induced CG-4 cells using an antibody raised against agnoprotein. The position of the GFP-agnoprotein band (35 kDa) is indicated by an arrow. The asterisk depicts a nonspecific band (30 kDa). (Bottom) Immunoblot analysis demonstrating the presence of GFP (27 kDa) and GFP-agnoprotein (35 kDa) in uninduced and induced CG-4 cells by use of an anti-GFP antibody. (B and C) Phase-contrast and fluorescent images of control CG-4 cells expressing GFP- and GFP-agnoprotein-producing cells under uninduced and induced conditions.

