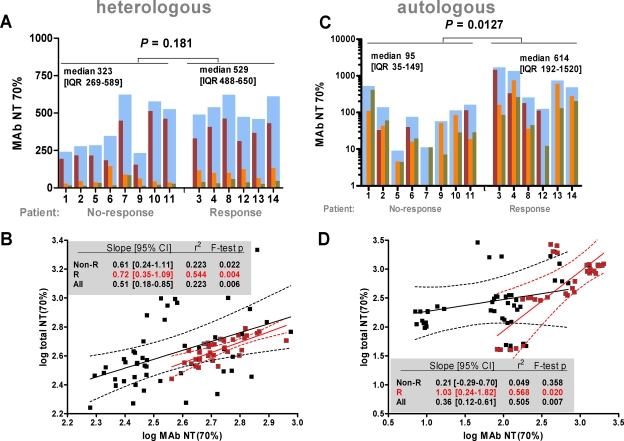
FIG. 2.
Dissection of MAb contribution to neutralization activity. (A and C) Comparison of mean MAb-mediated NT70s between weeks 2 and 12 for nonresponding and responding patients against the heterologous virus JR-FL (A) and the autologous viruses (C). Dark red, orange, and green bars represent 2G12-, 2F5-, and 4E10-mediated activities, respectively. Cumulative MAb NTs (sum of all three MAb NTs) (blue bars) for each patient were used to compare the effects of MAb neutralization in responders and nonresponders. Median (interquartile range [IQR]) MAb NTs and P values by the Mann-Whitney U test are provided. (B and D) Simple linear regression analysis of interdependency between total and MAb-mediated neutralization activities against the heterologous virus JR-FL (B) and autologous viruses (D) using robust methods of variance estimation to adjust for intrapatient clustering of measurements. For regression model output and measures of goodness of fit, see insets. Note that confidence intervals (CI) not encompassing zero indicate statistically significant slopes. Black and red symbols represent nonresponders and responders, respectively. Data are means from two to four independent experiments.

