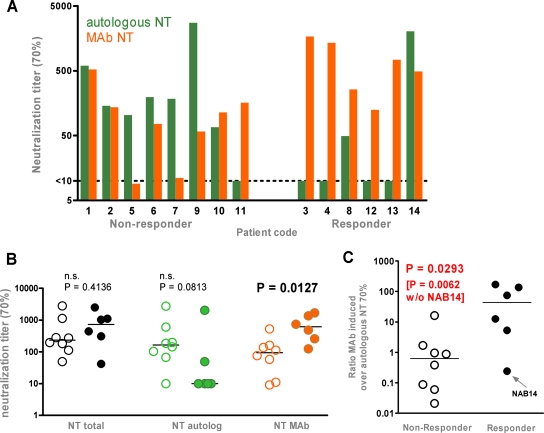
FIG. 3.
Influence of MAb-mediated neutralization activity on treatment outcome. Shown are analyses of mean NTs between weeks 2 and 12. (A) Cumulative MAb NT70s (orange bars) and autologous neutralization activity (green bars) against autologous viruses in nonresponders and responders. (B) Comparison of total (black), autologous-antibody-mediated (green), and MAb-mediated (orange) NT70s against autologous viruses in nonresponding (open symbols) and responding (solid symbols) patients. Group comparisons were performed using the Mann-Whitney test. (C) Ratio of MAb-induced responses to autologous responses in responding (solid circles) versus nonresponding (open circles) patients. Group comparisons were performed using the Mann-Whitney test.

