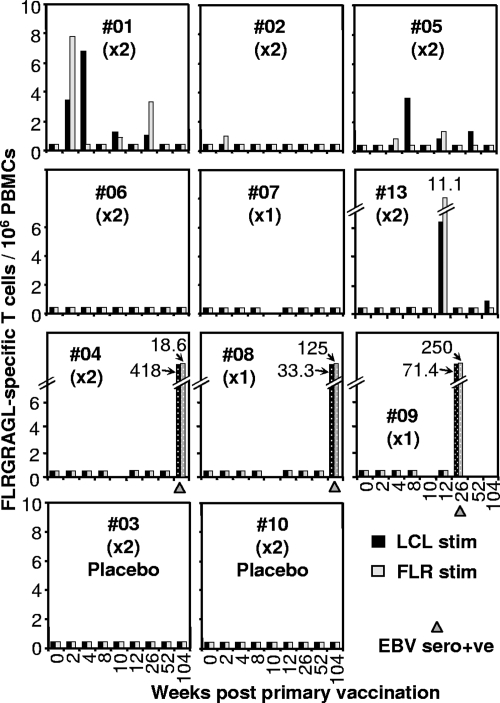
FIG. 2.
LDA. Fresh PBMC from the same vaccines as described in the legend to Fig. 1 were analyzed by LDA. Cultures were stimulated with either autologous LCLs (black bars) or FLR peptide (10 μg/ml) (gray bars) and assessed in 51Cr release assays. Speckled bars illustrate responses after EBV seroconversion. The time when serology first indicated EBV seroconversion is indicated with a gray triangle. Bars at 0.4/106 PBMC represent no significant response and are shown to indicate that an assay was performed on PBMC collected at that time point.

