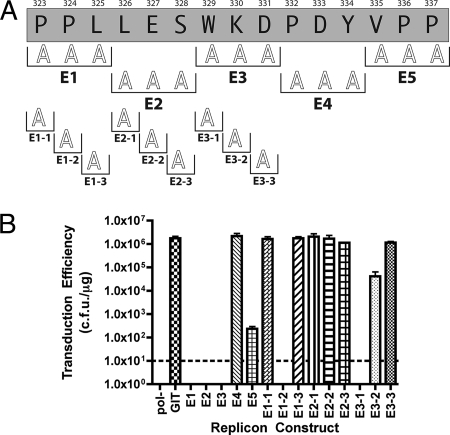
FIG. 5.
(A) Sequence of the E deletion from Fig. 1B showing additional alanine scanning mutagenesis performed. Numbering and clone designations are as described in the legends to Fig. 2A and 3A. (B) Graph of transduction efficiency for each replicon construct shown in panel A. Graph labeling and controls are as described in the legend to Fig. 1C.

