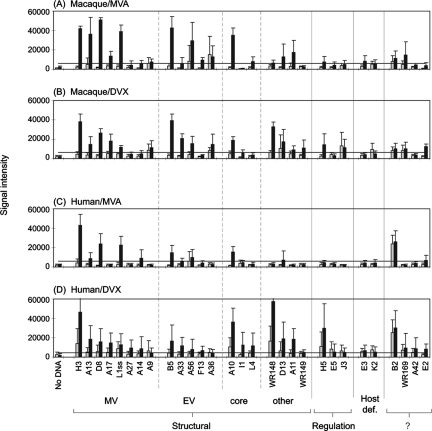
FIG. 8.
Summary of antibody profiles for humans and macaques. Humans and macaques were inoculated with Dryvax (DVX) or MVA according to the schedules shown in Fig. 1. Bars represent average SIs (+ SD) of the top-ranking antigens for all four cohorts combined: gray bars, prevaccination; black bars, postvaccination. (A) Macaque responses, pre- and 14 weeks post-MVA (“MVA/MVA” in Fig. 1B; n = 6). (B) Macaque responses pre- and 6 weeks post-Dryvax (“−/DVX” in Fig. 1B; n = 6). (C) Human responses pre- and 6 weeks post-MVA (n = 10). (D) Human responses pre- and 4 weeks post-Dryvax (n = 25). This last panel consisted of 13 individuals undergoing primary responses and 12 individuals after boosting. Positive signals in prevaccination signals in the human/Dryvax group (e.g., H3, A10, and WR148) are due to antibodies still detectable in the sera of previously vaccinated individuals (n = 12); a cutoff, represented by the horizontal bar, was set as the average signal (+ 10 SD) of “no-DNA” control spots with postvaccination sera.

