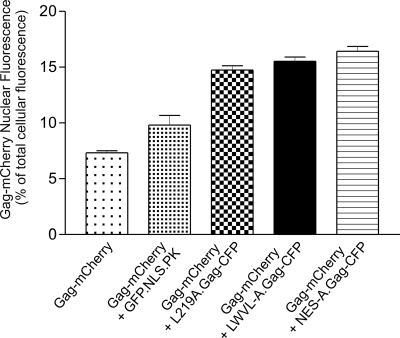
FIG. 3.
Quantification of the nuclear localization of wild-type and NES mutant Gag proteins. QT6 cells transfected with the indicated plasmid DNA were imaged with laser confocal microscopy using an excitation wavelength of 543 nm for mCherry. Total cellular and nuclear fluorescence intensities were measured, and Gag-mCherry nuclear fluorescence was calculated as the nuclear intensity divided by the whole-cell intensity. Each bar represents the average ratio of the nuclear to total cellular fluorescence. At least 100 cells were measured from three separate transfections, except for GFP.NLS.PK, for which 46 cells from two transfections were analyzed.

