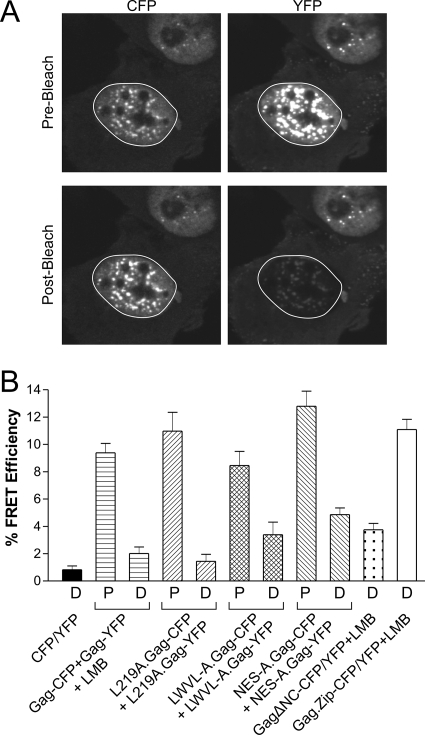
FIG. 6.
Intranuclear Gag-Gag interactions assessed by acceptor photobleaching FRET analysis. (A) FRET analysis was performed on cells coexpressing NES-A.Gag-CFP and NES-A.Gag-YFP. Confocal images through the nuclear plane were obtained prior to photobleaching (top). The nuclear region of interest, indicated by the white circle, was subjected to bleaching of the YFP (acceptor) fluorophore using a high-intensity laser at a wavelength of 514 nm, resulting in a significant loss of the signal in the postbleach NES-A.Gag-YFP image (lower right). The increased intensity of the NES-A.Gag-CFP fluorescence in the postbleach image (lower left) resulted from the decreased transfer of energy from the CFP fluorophore (donor) to YFP. (B) QT6 cells expressing the indicated proteins demonstrating punctate (P) or diffuse (D) phenotypes (as shown in Fig. 5) were analyzed using FRET. The FRET efficiency (percent) for each condition was calculated according to the equation shown in Materials and Methods. FRET experiments were performed a minimum of 10 times from at least two separate transfections. The mean FRET efficiency was calculated and graphed, with error bars representing standard errors of the means.

