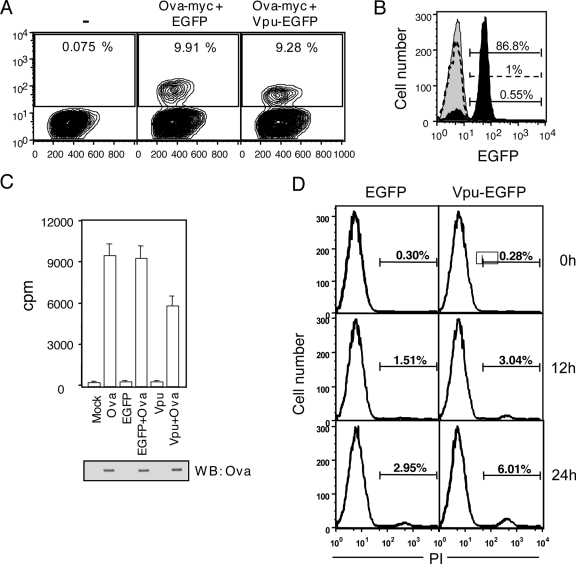
FIG. 6.
Vpu attenuates T-cell activation by APCs. (A) Two-parameter plots showing frequencies of Ova-myc expression in untransfected BMC-2 cells (−) or BMC-2 cells transfected to express Ova-myc plus EGFP or Ova-myc plus Vpu-EGFP, as indicated. The gates for OVA-myc-P+ cells are also shown. (B) Histograms show staining levels for Vpu-EGFP in Ova-myc-P+ cells from Ova-myc- plus EGFP-transfected (dotted curve) or Ova-myc- plus Vpu-EGFP-transfected (black shaded curve) cultures. The gray shaded curve is the isotype control curve. (C) Ova-specific MHC II-restricted responses of primary T cells from OT-II transgenic mice to variously transfected BMC-2 cells, as indicated. All data are means ± standard errors for triplicate cultures. T-cell activation was measured as [3H]thymidine incorporation into cellular DNA. The Western blot (WB) shows the expression of Ova in transfected cells stained with anti-myc antibodies. (D) Histograms showing propidium iodide staining of BMC-2 cells transfected with either Ova-myc plus EGFP or Ova-myc plus Vpu-EGFP at different times into the stimulation assay. Cells at 0 h correspond to those immediately after Ficoll-Hypaque purification or at ∼12 h posttransfection.

