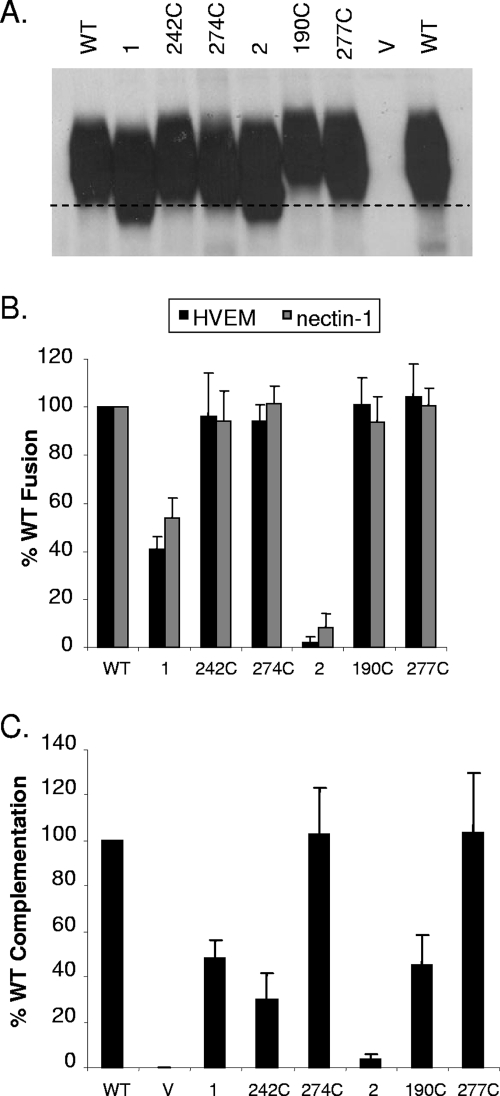
FIG. 8.
Characterization of gD single cysteine mutants. (A) Western blot of single cysteine mutants. Samples were boiled for 5 min in buffer lacking dithiothreitol. The black dashed line corresponds to migration of WT gD and is used for reference. The blot was probed with gD PAb R8. (B) Cell-cell fusion with single cysteine mutants. Cell-cell fusion was performed as described for Fig. 6B. Fusion activity is the average of five independent experiments, and the error bars represent the standard errors. (C) Virus complementation with single cysteine mutants. Complementation was performed as described for Fig. 7. The results represent the averages of three independent experiments, with their standard errors shown as error bars. V, vector-transfected cells.

