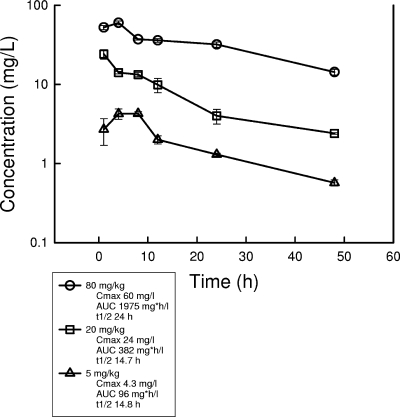
FIG. 1.
Pharmacokinetics of anidulafungin in sera of neutropenic infected mice following three single intraperitoneal doses of 5, 20, and 80 mg/kg. Each symbol represents the mean concentration for three mice and triplicate assays. The error bars represent the standard deviations. t1/2, half-life of the drug in serum.

