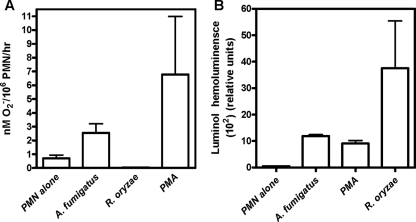
FIG. 2.
O2− release by HPMNs challenged with no stimulus, PMA, or hyphae of R. oryzae and A. fumigatus. (A) Extracellular O2− release by HPMNs (106 cells) as measured by cytochrome c reduction assay; P = 0.06 for R. oryzae- versus A. fumigatus-induced extracellular O2− release (hypha/HPMN ratio, 1:10). (B) Total (intracellular generation and extracellular release) O2− production by HPMNs (106 cells) assessed by luminol-dependent chemiluminescence. This chemiluminescence assay is based on the ability of luminol to enter cellular membranes and measures the total amount of O2− production (intracellular generation and extracellular release) (13). P = 0.1 for R. oryzae- versus A. fumigatus-induced extracellular O2− release. The error bars indicate standard deviations.

