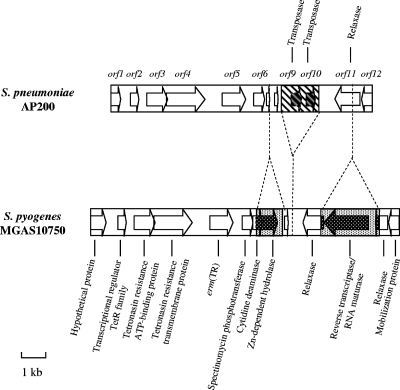
FIG. 1.
Schematic representation of a 10,582-bp DNA fragment enclosing erm(TR) in AP200 compared to the corresponding region of MGAS10750 with its annotations (NC_008024). Arrows indicate ORFs and the direction of their transcription. The regions unique to AP200 are indicated by striped areas, and the regions unique to MGAS10750 are indicated by dotted areas.

