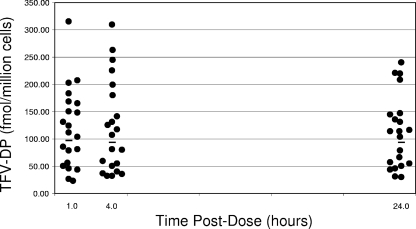
FIG. 3.
Time postdose (in hours) is shown on the x axis. Intracellular TFV-DP concentrations (in femtomoles/million cells) are shown on the y axis. The horizontal lines indicate the geometric mean TFV-DP concentrations at each of the three time points. The geometric mean (95% CI) TFV-DP concentrations at 1, 4, and 24 h postdose were 96.4 (71.5 to 130), 93.3 (68 to 130), and 92.7 (70 to 123) fmol/million cells.

