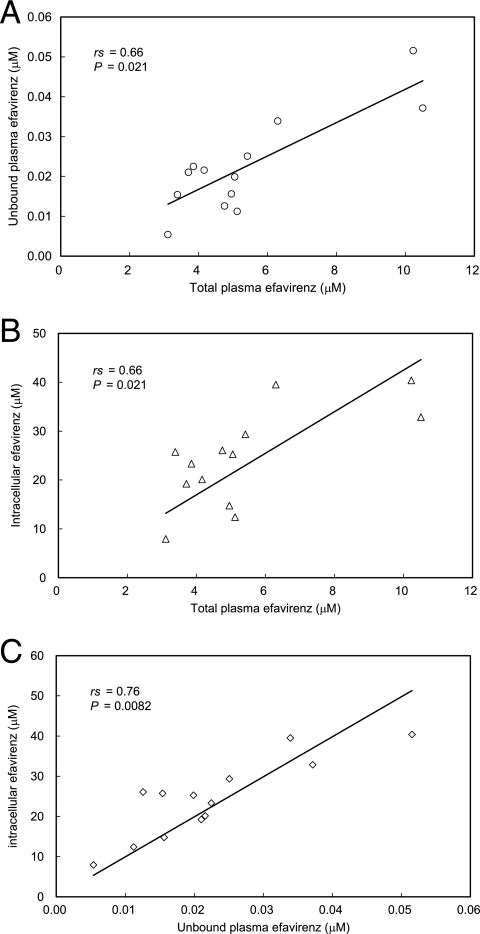
FIG. 4.
Relationship between total plasma efavirenz and unbound plasma concentrations (A), total plasma and intracellular concentrations (B), and unbound plasma and intracellular concentrations (C) in samples from 13 patients receiving antiretroviral therapy that included efavirenz treatment. Data were analyzed by Spearman rank correlation.

