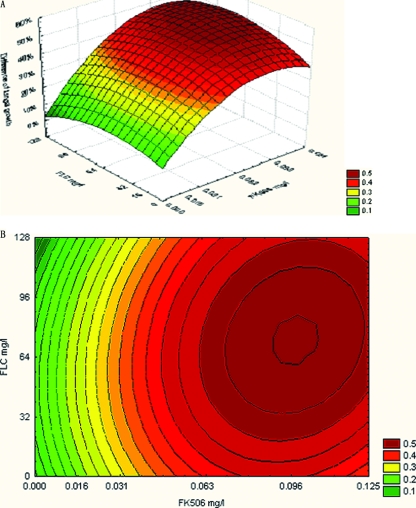
FIG. 1.
The three-dimensional (A) and contour (B) plots of interaction between FLC and FK506 against resistant C. albicans CA10 based on the ΔE model. The difference between the predicted and the measured percentage of fungal growth (ΔE = Epredicted − Emeasured) is shown on the z axis. Epredicted = EA × EB, where EA and EB were the experimental percentages of growth of each drug action alone, respectively. Emeasured is the percentage of fungal growth when drugs were used in combination. The ΔE value of each well was the average of triplicate results. Higher ΔE values suggested stronger synergistic interactions between FLC and FK506.

