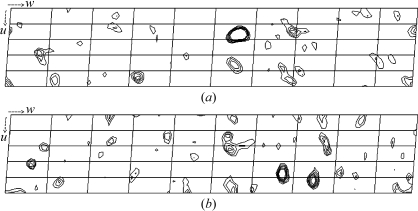
Figure 2.
Bijvoet difference Patterson maps (v = 0.5 Harker section) at 3.5 Å resolution calculated using the data from the Os derivative (a) and the Pt derivative (b). The contour lines are drawn from 1.5σ to 4.0σ, with an increment of 0.5σ. The height of the highest peak of Os is 9.6σ and that of Pt is 5.2σ.

