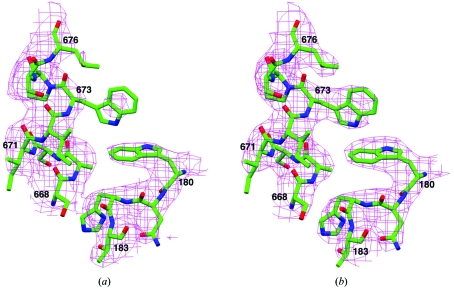
Figure 3.
Representative electron-density map for yeast CPSF-100 (Ydh1p). (a) Electron-density map for residues 180–183 and 668–676 after SIRAS phasing at 3.0 Å resolution. (b) Electron-density map for the same residues after NCS averaging among the three crystal forms. The maps were weighted by the figure of merit from phasing or NCS averaging and contoured at 1σ. This figure was produced with the program SETOR (Evans, 1993 ▶).

