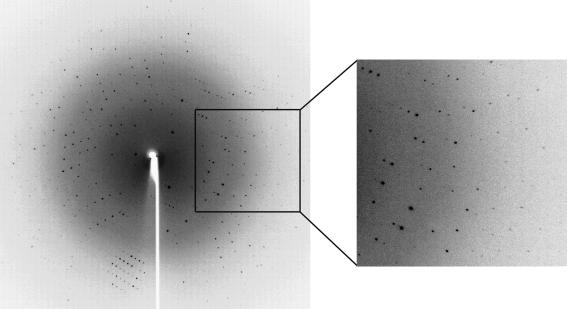
Figure 3.
Oscillation image (1°) of AtCSN7 core protein crystals. The crystal-to-detector distance was 180 mm. Diffraction data were observed to 2.06 Å. Data were collected and processed to a d min of 2.1 Å. Crystallization conditions were the same as for Fig. 2 ▶(b).

