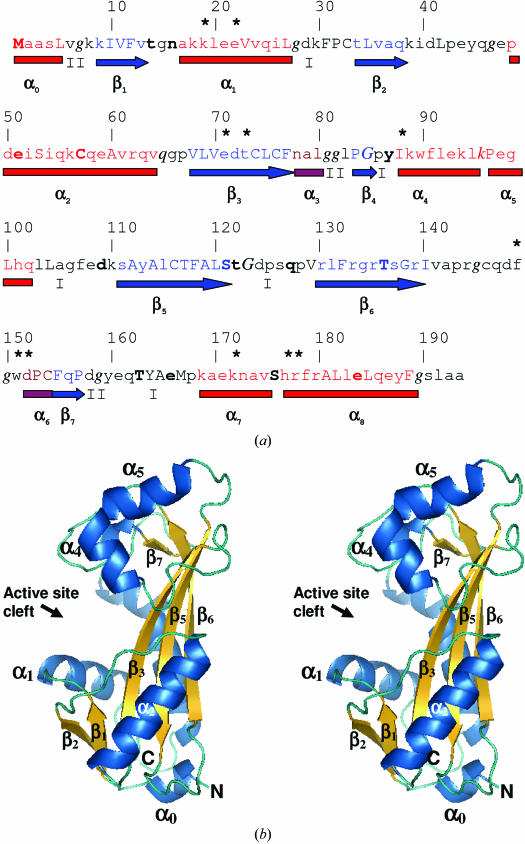
Figure 2.
(a) Annotated protein sequence and secondary-structure analysis using JOY software (Mizuguchi et al., 1998 ▶). The figure is organized as follows: line 1, residue numbers; line 2, an asterisk indicates putative active-site residues that were identified by comparison with the M. jannaschii NTPase structure complexed with the ATP analogue adenylyl imidodiphosphate (AMPPNP; PDB code 2mjp); line 3, JOY annotation of the protein sequence, where α-helices are red, β-strands are blue and 310-helices are maroon, solvent-accessible residues are in lower case, solvent-inaccessible residues are in upper case, residues making hydrogen bonds to main-chain amides are in bold, those making hydrogen bonds to main-chain carbonyls are underlined and those with positive ϕ torsion angles are in italics; line 4, α-helices are shown as red rectangles, 310-helices as maroon rectangles, β-sheets as blue arrows and the type of tight β-turns are indicated as I or II; line 5, major secondary-structure elements are named as defined for M. jannaschii NTPase (Hwang et al., 1999 ▶). (b) Cross-eyed stereo diagram of the overall structure of human ITPA. This figure was produced using PyMOL (DeLano, 2002 ▶).

