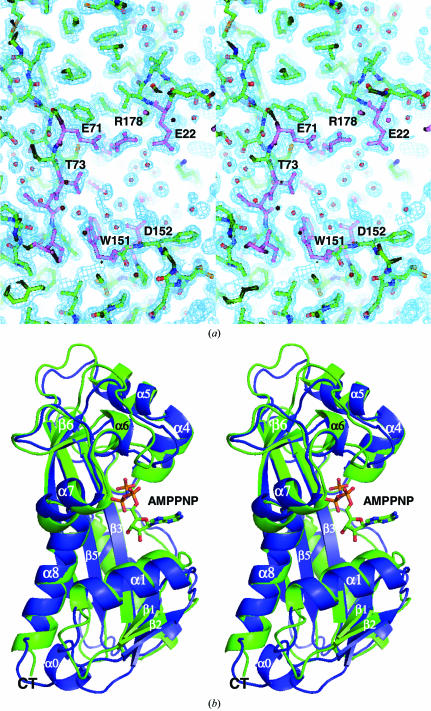
Figure 4.
(a) Cross-eyed stereo pair of the electron density surrounding the active site of human ITPA. The REFMAC/σA-weighted 2mF o − DF c map is displayed at 1σ. Active-site residues are highlighted with violet bonds and water molecules are shown as spheres (Murshudov et al., 1997 ▶; Read, 1997 ▶). Although the protein was crystallized with a 1:1 molar ratio of XTP, the active site appears to be empty. (b) Cross-eyed stereo pair of the superposition of ITPA (blue) onto monomer A of the M. jannaschii enzyme (green; PDB code 2mjp). The AMPPNP molecule bound to the M. jannaschii enzyme is shown in ball-and-stick format. This view is rotated 180° about the vertical relative to Fig. 2 ▶(b).

