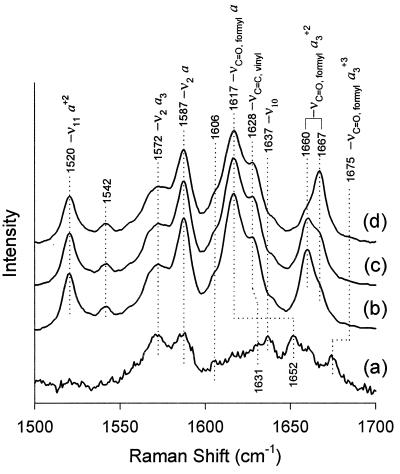
Figure 1.
Resonance Raman spectra of reduced aa3 in the high-frequency region as a function of time. The excitation frequency was 413.1 nm, and the laser power at the sample was ≈10 mW. The purified enzyme (60 μM) was reduced anaerobically by dithionite, in 100 mM Mes, pH 6.0, 1 mg/ml lauryl maltoside. The spectra shown are (b) immediately (≈1 min) after reduction, (c) after 15 min, and (d) after 50 min. Also shown for comparison is the spectrum of the oxidized enzyme (spectrum a, laser power ≈0.1 mW).

