
FIG. 7.
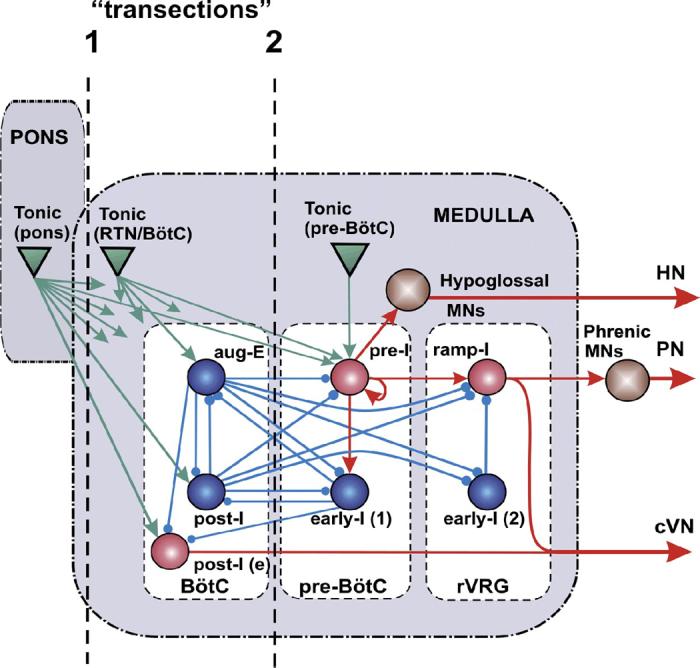
Schematic of the computational model of the brain stem respiratory network. Model includes interacting neuronal populations within major brain stem respiratory compartments (Pons, BötC, pre-BötC, and rVRG). Spheres represent neuronal populations (excitatory, red; inhibitory, blue; motoneuronal, brown); green triangles represent sources of tonic excitatory drives (in pons, RTN/BötC, and pre-BötC compartments) to different neural populations (only several drives are shown connected; for the full drive connections, see Table 3 in APPENDIX). Excitatory and inhibitory synaptic connections are indicated by arrows and small circles, respectively. Simulated “transections” (dashed lines) mimic those performed in situ.