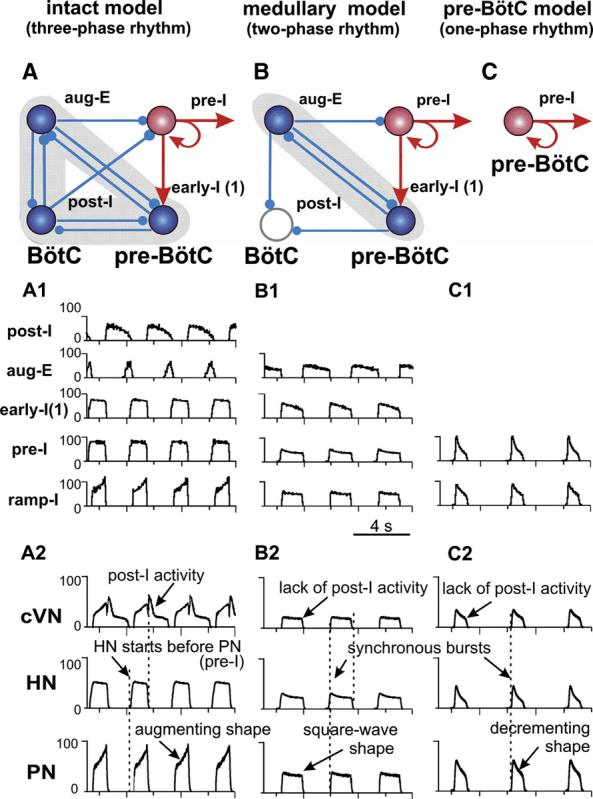
FIG. 8.

A–C: key elements and circuits within the intact (A), medullary (B), and pre-BötC (C) models involved in rhythmogenesis (excitatory drives are not shown; excitatory populations, red; inhibitory, blue). A1–C1: activity of selected neuronal populations in the model. Activity of each population is represented by a histogram of average neuronal spiking frequency within population (spikes/s/neuron, bin size = 30 ms). A2–C2: Motor outputs (cVN, HN, PN) in each model.
