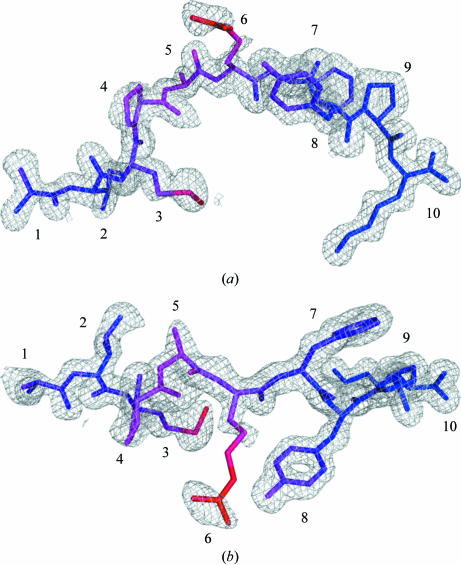
Figure 1.
Electron density of the AIMPARFYPK peptide. The electron density is contoured at 1σ and clearly shows density for all of the peptide including the additional N-terminal alanine (left). The peptide is coloured according to B values from blue to red (13–48 Å2). (a) Side view, (b) top view. All figures were prepared with PyMOL (DeLano, 2002 ▶).

