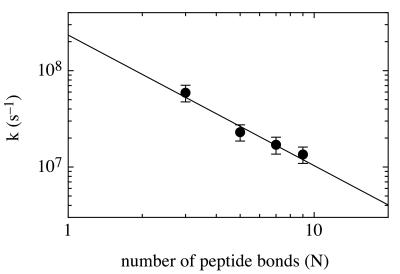
Figure 3.
Distance dependence of the rate of intramolecular chain diffusion. The rates of contact formation in the different peptides A(n = 1–4) are plotted against the number of peptide bonds (N) separating donor and acceptor. Experimental conditions were as in Fig. 2. The peptide concentration was 15 μM. A linear fit of the double exponential plot gives a slope of −1.36 ± 0.26.

