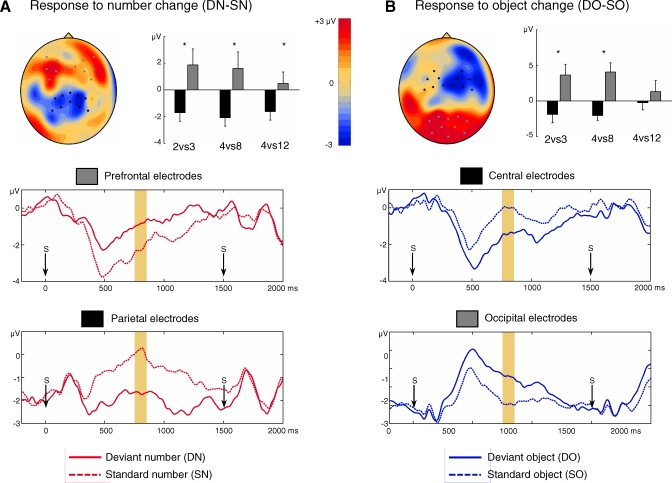
Figure 2. Scalp-Measured Responses to Number Change and to Object Change.
(A and B) Upper panels show the topography of the difference between the deviant and standard conditions, averaged between 750 to 850 ms after stimulus onset ([A] shows the response to number change; [B] shows the response to object change). Dots mark the location of the electrodes used for ANOVA. Histograms depict effect sizes averaged across these electrodes, for three different groups of infants respectively exposed to numbers two versus three, four versus eight, or four versus 12 (an asterisk [*] indicates p < 0.05). Lower graphs show the time course of voltage averaged over the groups of electrodes used in the ANOVAs. Arrows indicate stimulus onsets (every 1,500 ms).

