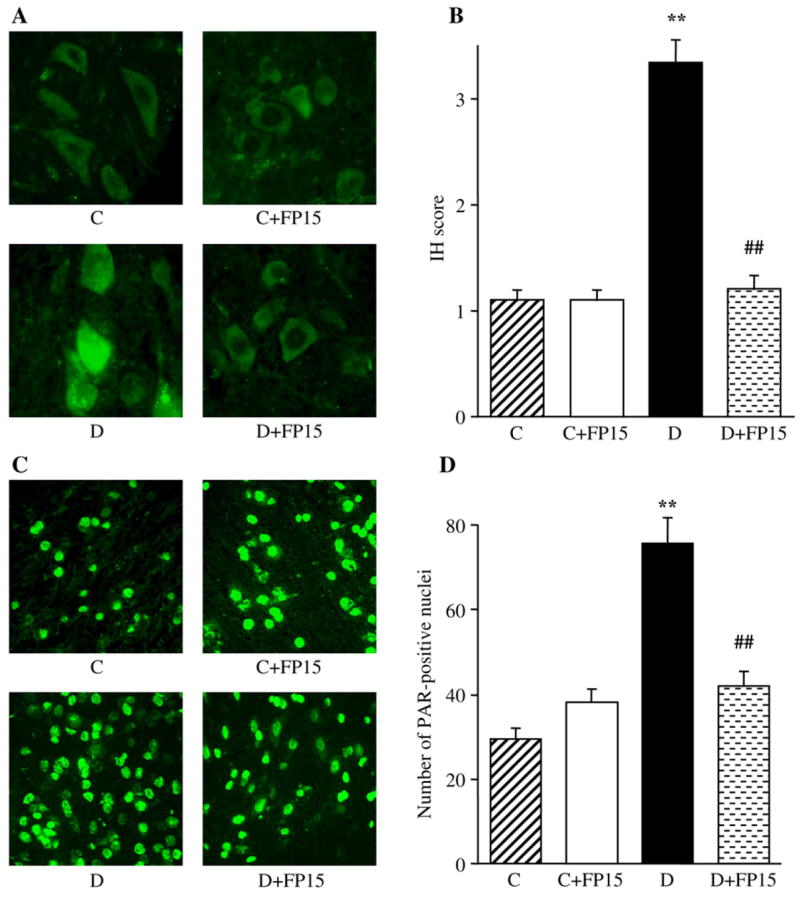
Fig. 5.

Representative microphotographs of immunofluorescent staining of nitrotyrosine (A) and poly(ADP-ribose) (C) in the grey matter of spinal cord of control mice and diabetic mice with and without a peroxynitrite decomposition catalyst treatment. Magnification ×40. Scores of nitrotyrosine immunofluorescence (B) and the numbers of poly(ADP-ribose)-positive nuclei (D) in the grey matter of spinal cord of control and diabetic mice with and without a peroxynitrite decomposition catalyst treatment. Mean±SEM, n=9–11 per group. C — control mice; D — diabetic mice. bp<0.01 vs control mice; dp<0.01 vs untreated diabetic mice.
