
Figure 1.
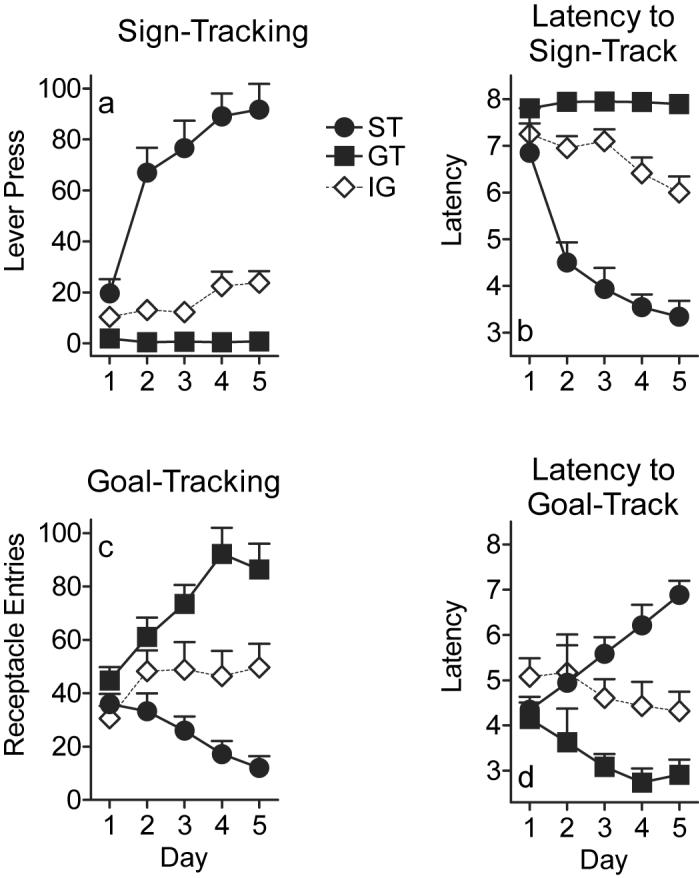
Lever press behavior and food receptacle entries during CS presentation. Squares represent goal-trackers (GTs; n=14), circles represent sign-trackers (STs; n=14), and open diamonds represent the intermediate group (IG; n=12). a) Mean lever press ± SEM on each of the 5 days of training. b) Mean latency to lever press ± SEM (in seconds), with 8 being the maximum latency. c) Mean number of receptacle entries during CS presentation ± SEM on each of the 5 days of training. d) Mean latency to receptacle entry during CS presentation ± SEM (in seconds).