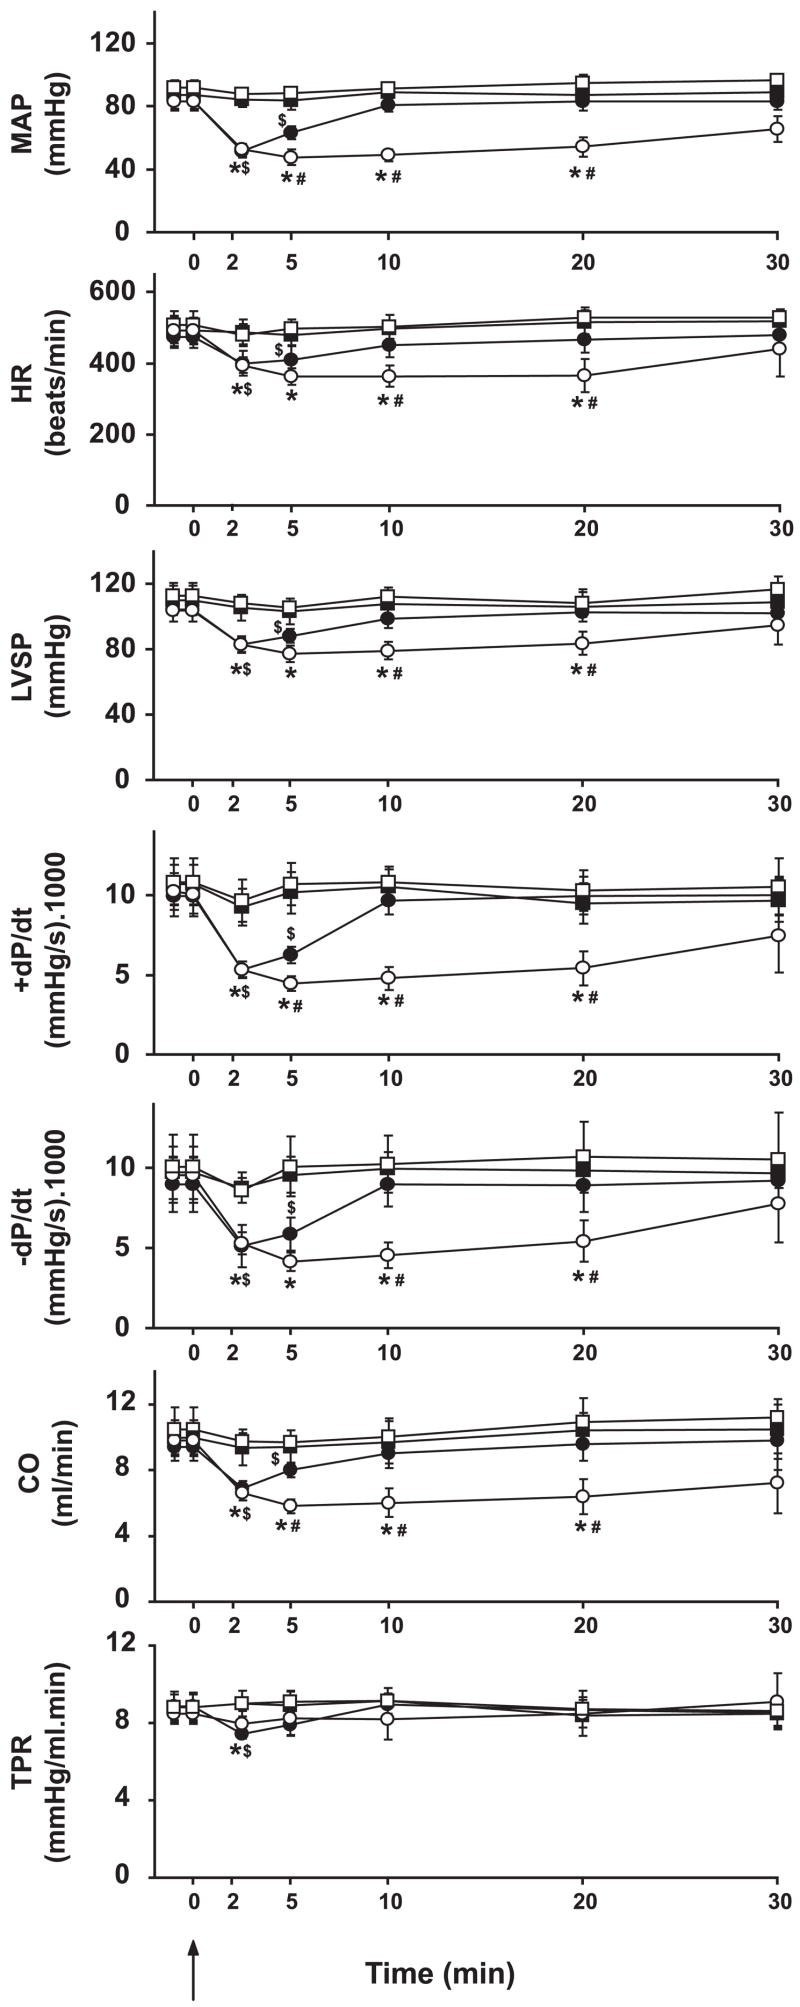
Fig. 5.
Hemodynamic effects of AEA in FAAH+/+ (solid symbols) and FAAH−/− mice (open symbols) after vehicle (circles) or AM-251 treatment (squares). Values are means ± SE; n = 5–7 mice for each condition. AEA was injected at 0 min, as indicated by arrow. Note that AM-251 blocks the major hemodynamic effects of AEA in both strains. Strain- and time-dependent differences were analyzed by two-way ANOVA. Student’s t-test was used after ANOVA for pairwise comparisons. Significance was assumed if P < 0.05 for FAAH+/+ pre- vs. posttreatment (*), for FAAH+/+ pre- vs. posttreatment ($), and for FAAH−/− vs. FAAH+/+ (#). LVSP, LV systolic pressure; +dP/dt and −dP/dt, pressure increment and decrement, respectively; CO, cardiac output; TPR, total peripheral resistance.

