
Fig. 3.
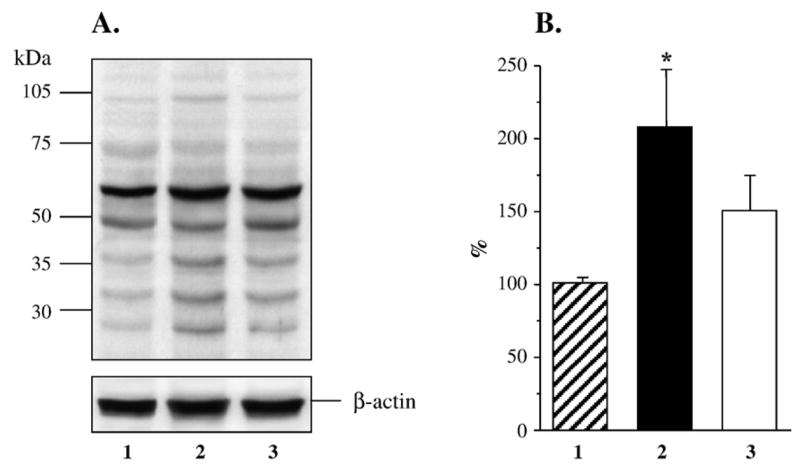
(A) Representative Western blot analysis of renal cortex nitrosylated proteins. Equal protein loading was confirmed with β-actin antibody. Lane 1, control group; lane 2, diabetic group; lane 3, diabetic group treated with fidarestat. (B) Total nitrosylated protein content in renal cortex of control rats (1, n = 6), diabetic rats (2, n = 6), and diabetic rats treated with fidarestat (3, n = 4). The data are expressed as means ± SE. Total nitrosylated protein content in control rats is taken as 100%. *p < 0.05 vs control group.