Figure 2.
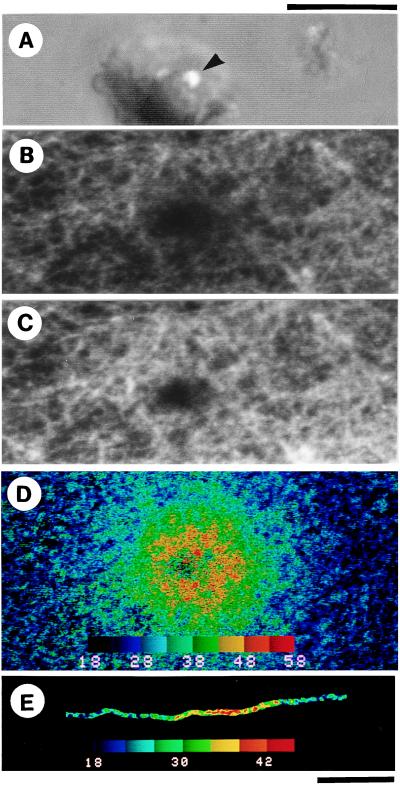
Imaging of temperature distribution on actin filaments around the metal aggregate. (A) Phase-contrast image corresponding to the central part of fluorescence images (B–D). A laser beam was focused at a periphery (shown by an arrowhead) of a lump of Al particles of irregular shape. (B–D) Fluorescence images of a two-dimensional network of rhodamine phalloidin-labeled actin filaments (12 μg/ml) attached to heavy meromyosin molecules that adhered to the glass surface coated with nitrocellulose (24). Excess actin filaments were washed away, so that filaments were mostly in focus and thus within 1 μm of the glass surface. (B) Fluorescence image of the actin network taken in a single video frame coincident with laser illumination for 1/30 s under shutter control. A periphery of a ≈10-μm lump of Al particles observed in A was illuminated. Fluorescence under and close to the metal aggregate disappeared because of excessively high temperature. (C) A single-frame fluorescence image obtained two video frames after B; the image was indistinguishable from that obtained before laser illumination at 18°C ± 1°C, i.e., temperature of the coverslip. (D) Two-dimensional temperature distribution constructed from the ratio of the fluorescence intensities of the images B and C. (E) Temperature distribution on a single actin filament; only in this micrograph, the background fluorescence intensity was subtracted. In D and E, the temperature is scaled in pseudocolor as shown in color bars in °C unit. (Scale bars: upper one for A–D, lower one for E, 10 μm.)

