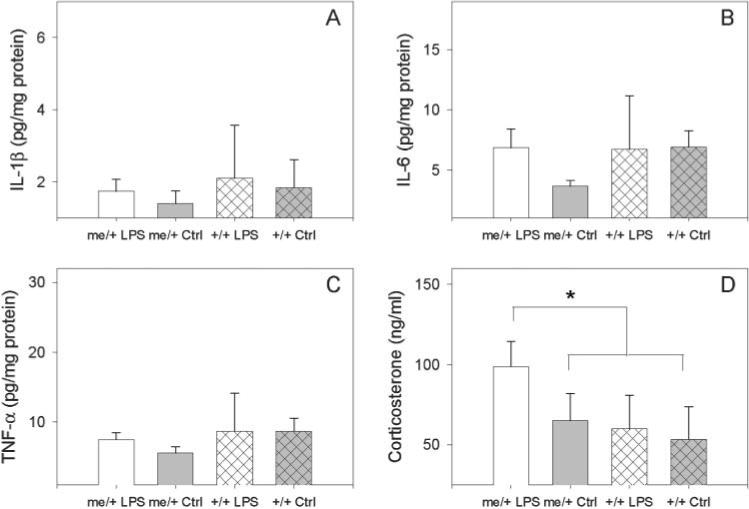
Fig. 3. Brain pro-inflammatory cytokines and serum CORT.

(A) IL-1β in the brains of LPS-treated and control (PBS) me/+ and +/+ mice after 4 weeks of biweekly injections of 50 μg of S. minnesota re595 LPS. (B) IL-6 levels in the brains of LPS-treated and control me/+ and +/+ mice. (C) TNF-α levels in the brains of LPS-treated and control me/+ and +/+ mice. (D) Serum corticosterone levels in behaviorally affected (LPS-treated me/+ mice) and unaffected (LPS-treated +/+ and control me/+ and +/+ mice). Cytokine levels are expressed as pg cytokine per mg total protein. Statistical significance was measured by one-way ANOVA followed by the Student-Neuman-Keuls method. *P<0.05.
