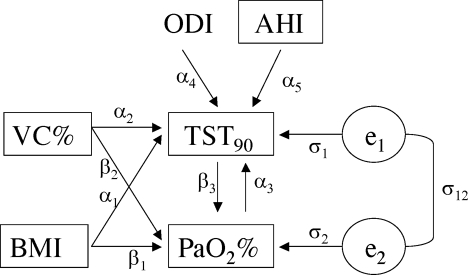
Figure 1.
Path diagram of the dependencies of the TST90−PaO2 feed back structural equations designed (*). The observed variables are enclosed in boxes, and the unobserved variables (error terms) are circled. An arrow from one variable to another indicates that the first variable has a direct influence on the second, two straight single-headed arrows connecting two variables indicate a reciprocal direct influence, and a curved two-headed arrow signifies a correlation between two variables. The path coefficients displayed on the arrows are the regression coefficients for the observed variables, and the residual variances/covariances for the unobserved errors.
(*) VC%: vital capacity in % of predicted; BMI: body mass index (Kg/m2); TST90: percent sleep time spent with SaO2 <90%; PaO2%: partial oxygen arterial pressure in % of predicted; ODI: oxygen desaturation index; AHI: apnea-hypopnea index. The SEM is written as:
TST90 = α1 BMI + α2 VC% + α3 PaO2% + α4 ODI + α5 AHI + e1
PaO2% = β1 BMI + β2 VC% + β3 TST90 + e2
var (e1)= σ1; var (e2)= σ2; cov (e1; e2) = σ12

