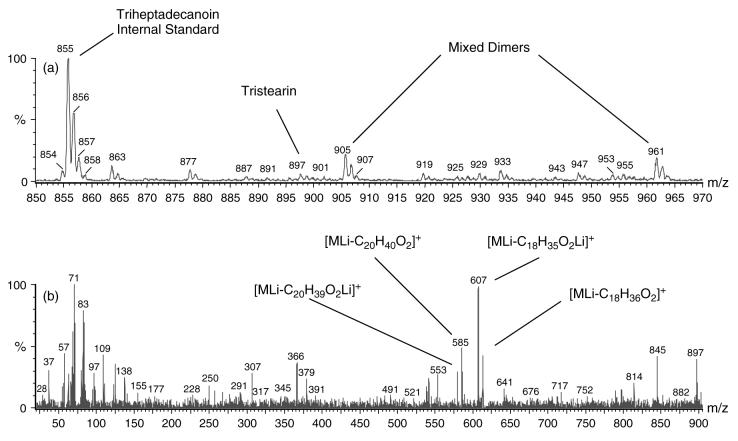
Figure 10.
(a) Expanded mass axis of the triester spectral region (m/z 850–970) of normal tear extract lithium adducts illustrating the occurrence of mixed dimers and low concentrations of triacylglycerols present in the extract. (b) Product ion spectrum with peak assignments of informative product ions of the m/z 897 precursor identified as an isomeric mixture of tristearin and 1-arachidin-2-stearin-3-palmitin.

