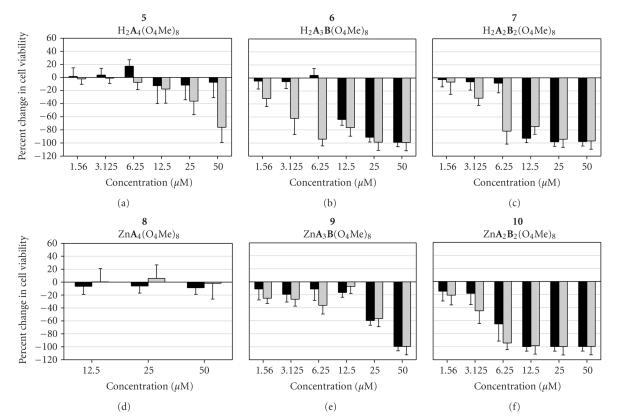
Figure 3.
Percent cell viability, relative to DMSO control, of A549 (black bars) and WI-38 VA13 (gray bars) cells after a 72-hour exposure to pzs at varying concentrations. (Note that a 0% change in the percent cell viability correlates to cells which grew at the same rate as the control cells; negative values correlate to cells which grew at rates below those of the control cells.)

