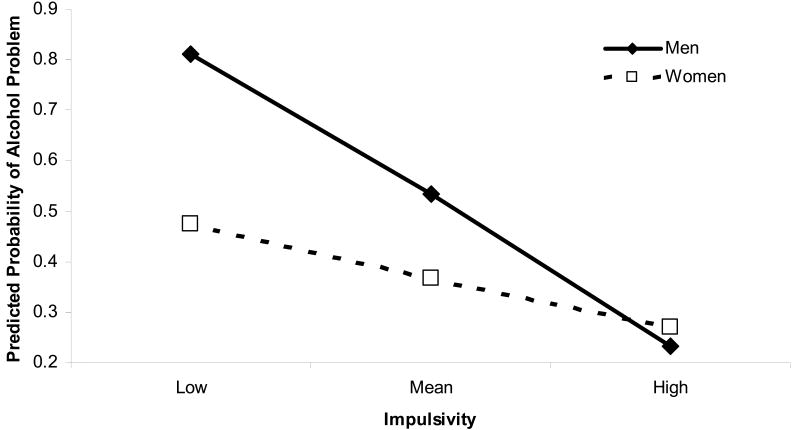
Figure 1.
Plot of significant gender x impulsivity interaction. Probabilities of being assigned to the alcohol problem category are plotted for men and women at the mean, low (-1 SD) and high (+1 SD) values of impulsivity as measured by Stop Signal Reaction Time (SSRT). Note that greater SSRTs indicate higher levels of impulsivity (i.e. it takes longer to inhibit a prepotent behavior).

