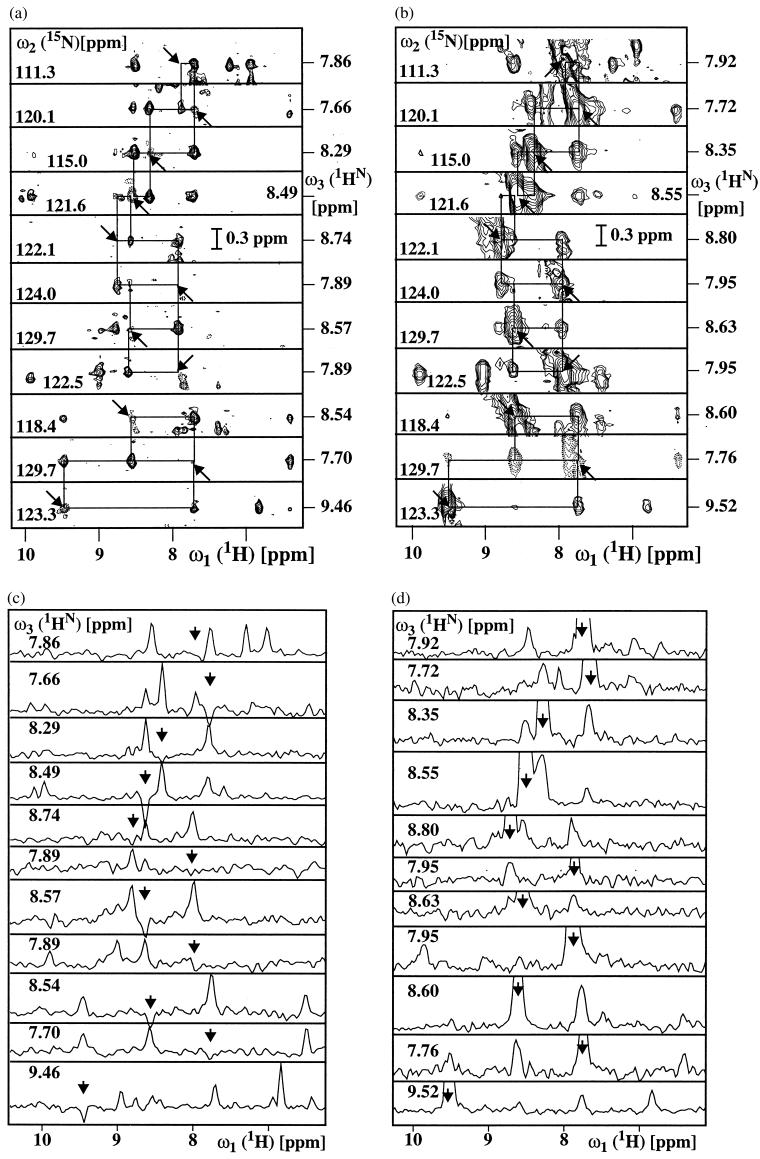
Figure 3.
Comparison of corresponding spectral regions in a 3D NOESY-ZQ-[1H,15N,1H]-TROSY spectrum recorded with the scheme of Fig. 1b (a, c) and a conventional 3D 15N-resolved [1H,1H]-NOESY spectrum recorded according to ref. 16 (b, d). Both experiments were recorded with the sample of DHNA described in Fig. 2, using a Bruker DRX-750 spectrometer. Data size 128(t1)*30(t2)*1024(t3) complex points, t1max = 24 ms, t2max = 15 ms and t3max = 105 ms. Eight scans per increment were acquired, resulting in a measuring time of 34 h per spectrum. The spectra were processed with the program prosa (22). (a and b): Contour plots of [ω1(1H),ω3(1H)] strips. NOE connectivities are shown with thin horizontal and vertical lines. (c and d): Cross-sections taken along ω1(1H) at the ω3(1H) positions of the diagonal peaks in the strips a and b, respectively. In a–d, the positions of the diagonal peaks are indicated by arrows.

