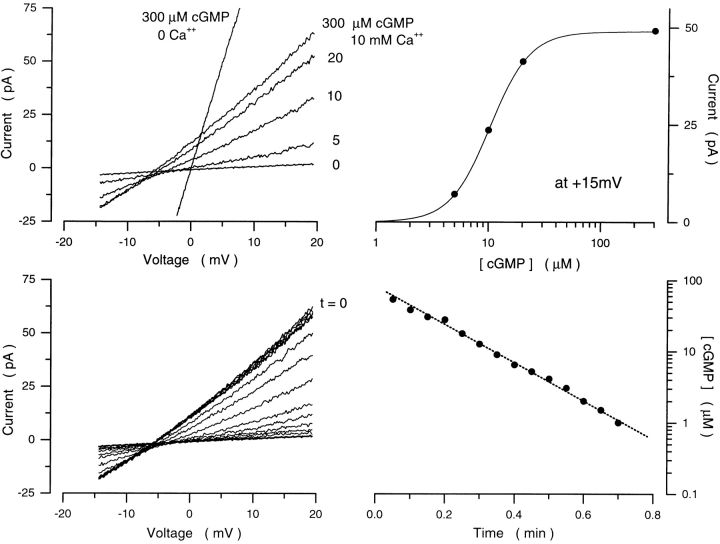
Figure 2.
The cGMP concentration ramp. (Top left) The rod membrane patch was first exposed to symmetric NaCl solutions free of divalent cations, and I–V curves recorded with a voltage ramp both before and after adding 300 μM cGMP. The I–V curve measured at 300 μM indicates the maximum possible current, and its intersection with the I–V curve measured at 0 cGMP defines the origin (0,0) of the I–V plane for this patch. Currents were then measured with 10 mM Ca2+ added to the cytoplasmic surface in the steady presence of 5, 10, 20, and 300 μM. (Top right) The current amplitude measured at a fixed voltage (+15 mV) in the I–V curves is a function of [cGMP] well described by the Hill equation (Eq. 3). For the data shown, K 1/2 = 10.3 μM and n = 2.48 define the “calibration” of the patch. (Bottom left) A step of 300 μM cGMP was next presented to the patch until a maximum, time-invariant current was observed. At t = 0, the superfusate was switched to the same solution, but free of cGMP. Rapid (500 ms) I–V curves were repeatedly measured at 2-s intervals as cGMP concentration declined. The concentration present at the moment any given I–V was recorded was determined by measuring the current amplitude at +15 mV and using the calibration curve in the top right. (Bottom right) Time course of cGMP washout from the patch determined from the I–V curves at bottom left. cGMP concentration in front of the membrane patch declined along a single exponential time course with time constant 12.6 s.

